Supply and Demand Curve
The supply and demand, and their relationship are the most fundamental concepts in economics that you must learn for writing papers in college. Moreover, it forms the foundation for further studies in economics and marketing. The supply and demand curve is the graphical representation of the relationship between the supply and demand of a commodity. In this article our PenMyPaper writer has discussed about the supply and demand curve in details to help you with your economics paper.
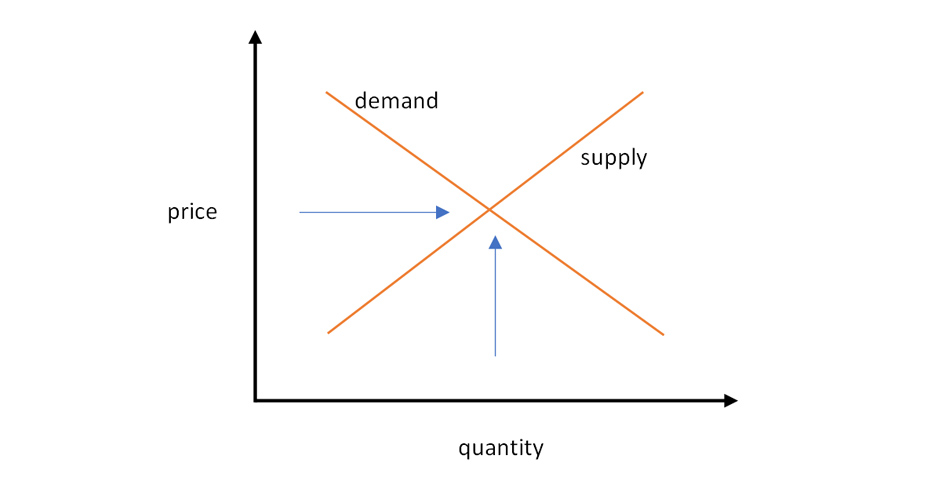
Before we dig deeper into the supply and demand curve, let us get through the basics. In economics the supply is the quantity of a commodity that a seller wants to sell to the customers. On the other hand, the demand is the quantity of commodity that the consumers want to purchase. The relationship between the demand and supply is represented in a curve or graph, which is often used as a price determination model. The price of a particular product and service is determined by the interaction between the supply and demand. The price resulting from the relationship between the supply and demand is called the equilibrium price. It highlights the balance between the demand and the supply of a commodity. Going further into each concepts may help you create your set of dissertation topics for your college assignment.
Demand and Demand Curve
The demand of a commodity depends of various factors, most important of which is the price among others such affordability, consumption trend, prices of other commodities, etc. For the sake of simplicity, we will consider every other factor other than the price to be constant. Therefore, we will simply examine the price variations and consumption of product in quantities. In the graphs shown above, it is clearly suggested that as the price of a commodity goes down, the consumers are willing to purchase more of it, thereby typically the demand curve is downward facing.
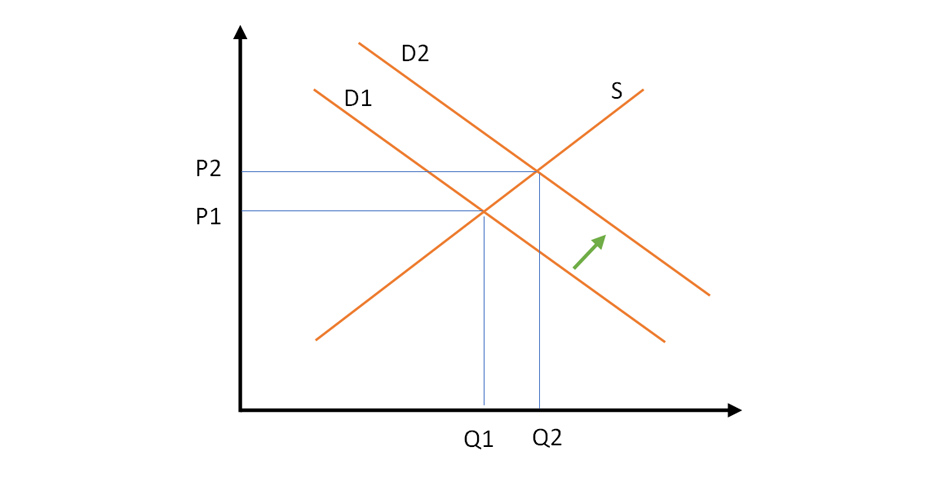
In the diagram shown above, highlights that as the demand increases from D1 to D2, the price of the commodities also increase from P1 to P2 along with the consumption quantity from Q1 to Q2. In simple words, increase in demand of a commodity, with no change in supply, leads to higher price and increased quantity. Now that we have explained the demand curve, let us take a look at the supply curve. Our perfect research paper writing service deals in a variety of domain and subjects; in case you feel stuck with any assignment, feel free to reach out to us.
Supply and Supply Curve
The supply of a commodity largely depends on the price of the product, along with other factors as well. But for simplicity we will consider those factors to be constant. The supply curve determines the relationship between price variations and quantity of commodities produced by the companies. This relationship when plotted on a graph becomes the supply curve. Typically, the supply curve is upward facing, which suggests that the companies are willing to sell more products as the prices of the commodity goes up, which in turn can lead to higher revenue.
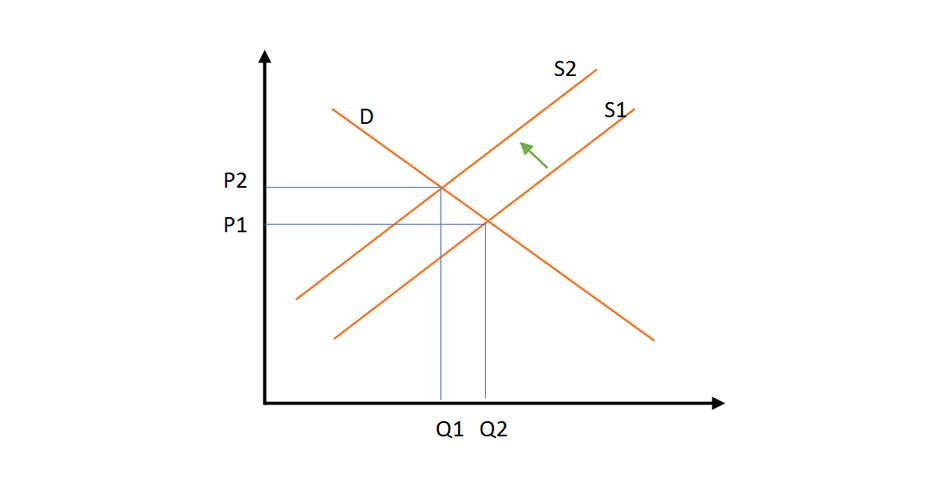
From diagram shown above, it can be stated that as the supply shifts from S1 to S2, there is a rise in price from P1 to P2 and a decrease in quantity of consumption from Q2 to Q1. In simple words, decrease in supply, with no change in demand, will lead to increase in price and decrease in quantity of consumption. Let us now look at how the supply and demand are adjusted in the market to maintain price equilibrium so that you don’t have to buy a paper on SWOT analysis Amazon or so company to figure out its demand and supply concept.
The Market Equilibrium
By using price mechanisms, the market tends to balance the demand and supply of commodities. For example, if the customers want to purchase more commodities than they are available, then the prices are likely to increase to curb the demand. On the other hand, if the customers buying less commodities than they are available, then the prices are lowered in order to stimulate more purchase. Thus, the market always has a tendency to move towards the equilibrium price. This balance between the supply and demand of commodities is known as market equilibrium.
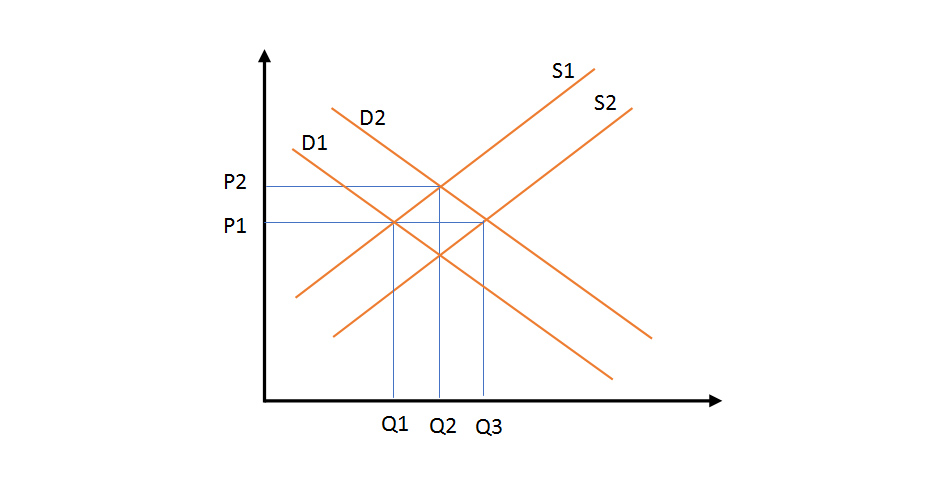
It should be noted that the as the demand increases the prices does not necessarily has to increase, if the companies decide to offer more commodities. In the graph shown above, the demand of the product increases from D1 to D2, but the price remains the same, as the supply is also increased from S1 to S2.
As the price of the commodities increase, the quantity offered to the market usually increases as well, simultaneously the propensity to make more purchase also declines. However, these changes do not necessarily have to be proportional. The responsiveness of supply and demand towards price variation is termed as price elasticity of demand or supply. It is calculated as the ratio of percentage of change in supply or demand to the percentage change in price. For example, if the price of a product declines by 10% and the demand of that product increases by 20%, then in that case the price elasticity for demand will be 2.
Want a Professional to Help You with Your Economics Paper? Hire Our Experts
Are your still searching for an expert to help you write essay papers? Look no further, we have got you covered. We work with a team of experts with more nearly a decade of working experience in premium academic writing. Be it a Nike mission statement or a business plan of your proposed company, we can offer you top quality papers custom written to your needs and preferences. Every paper that we deliver are completely free from plagiarism and are proofread for any grammatical errors, so that you can get the best quality possible. So, whenever you are struggling with your studies, simple go to Penmypaper and place your order and let our expert professionals take care of the rest.

